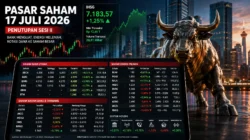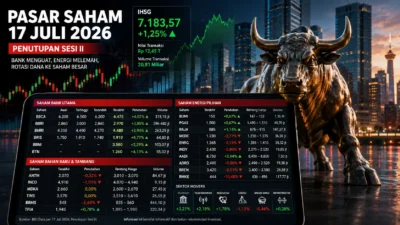



- First-Session Trading Summary
- Large Banks Keep the Index Moving
- Driving Sectors and Their Risk Factors
- Energy Dominates Volume, but Prices Lag Behind
- Third-Tier Stocks Accelerate More Aggressively
- Map of the Most Volatile Stocks
- Ten Stocks Absorb Billions of Shares
- Petrochemicals and Telecommunications Also Provide Support
- The Rally Faces a Rupiah Test
- JCI Support and Resistance Map
- Heavy Volume Does Not Guarantee a Healthy Rally
Large-cap banks provided measured support for the index. At the same time, investors chased several third-tier stocks with heavy volumes and double-digit gains.
The JCI opened at 6,197.47. It gained 0.36 percent from Friday’s closing position of 6,175.54.
The index then climbed to 6,245.98 at around 9:13 a.m. Western Indonesian Time. It gained 70.45 points, or 1.14 percent.
Market data recorded 385 advancing stocks and 149 declining stocks. Meanwhile, 431 stocks remained unchanged.
Trading volume reached 2.58 billion shares during the early observation period. Transaction value hit Rp1.93 trillion through 283,400 trades.
Data note: The figures in this report represent intraday trading. The latest prices do not represent the official first-session close.
First-Session Trading Summary
| Market Indicator | Data | What It Means |
|---|---|---|
| July 17 close | 6,175.54 | The basis for calculating the index change. |
| July 20 opening | 6,197.47 ▲ | The market immediately opened in positive territory. |
| Position around 9:13 a.m. WIB | 6,245.98 ▲ | Buying pressure increased after the opening. |
| Temporary change | +70.45 points | The JCI gained approximately 1.14 percent. |
| Trading volume | 2.58 billion shares | Liquidity increased from the start of trading. |
| Transaction value | Rp1.93 trillion | A substantial amount of money circulated early in the session. |
| Transaction frequency | 283,400 trades | Trading activity moved rapidly. |
| Advancing stocks | 385 stocks ▲ | The advance received fairly broad market support. |
| Declining stocks | 149 stocks ▼ | Selling pressure had not taken control of the market. |
| Unchanged stocks | 431 stocks | Many stocks had not participated in the rally. |
The table shows a relatively broad advance. The number of rising stocks exceeded the number of declining stocks by more than two times.
However, 431 stocks remained unchanged. This figure indicates that buying flows had not reached the entire market evenly.
The JCI accelerated after the opening. This pattern shows that buyers immediately built positions as trading progressed.
Nevertheless, an intraday surge does not guarantee that prices will hold. Investors may still lock in profits during the following session.
Large Banks Keep the Index Moving
The financial sector once again played an important role. Investors directed purchases toward large-cap banking stocks.
Shares of PT Bank Rakyat Indonesia (Persero) Tbk, or BBRI, opened at Rp3,000. The price gained Rp30 from the previous close of Rp2,970.
BBRI’s volume reached 192.96 million shares during the first hour of observation. That figure placed BBRI among the most actively traded stocks.
Gains in large banks had a broad impact on the JCI. Their significant capitalisation allows small price changes to move the index considerably.
The market also awaited Bank Indonesia’s Board of Governors Meeting on July 22, 2026. Its interest-rate decision could affect funding costs, lending, the rupiah and foreign investor appetite.
PT MNC Sekuritas analyst Herditya Wicaksana saw room for further limited JCI gains. However, the market still needed to consider correction risks after an extended rally.
The JCI had gained approximately 4.24 percent during the previous week. That rapid increase opened room for profit-taking.
Driving Sectors and Their Risk Factors
| Sector | Stocks Monitored | Main Driver | Risk | Outlook |
|---|---|---|---|---|
| Financials | BBRI and large banks | Foreign buying and anticipation of Bank Indonesia’s decision | A weaker rupiah and profit-taking | Limited positive ▲ |
| Energy | BUMI, DEWA and APEX | Commodity prices and geopolitical tensions | Speculative volume and commodity-price changes | Volatile ↕ |
| Telecommunications | TLKM and KBLV | Stock rotation and TLKM’s defensive character | KBLV’s surge could reverse quickly | Selective ↕ |
| Petrochemicals | TPIA | Heavy volume and index weighting | Naphtha prices, oil prices and rupiah weakness | Neutral ↔ |
| Property | PURI and RBMS | Demand for low-priced stocks and technical momentum | Thin liquidity and profit-taking | High risk ⚠ |
| Infrastructure | KOKA | Heavy volume and project expectations | Unconfirmed company catalysts | Speculative ↕ |
| Basic materials | CTTH | Rotation into second- and third-tier stocks | Volume and sustained demand | Limited ↕ |
The financial sector offered the most stable support. Large banks carried strong liquidity, capitalisation and influence over the JCI.
Energy recorded heavy volume. However, BUMI’s transactions had not produced a comparable price increase.
Telecommunications stocks displayed different characteristics. TLKM offered stability, while KBLV showed speculative momentum.
Property and infrastructure stocks recorded more aggressive gains. However, the market had not found equally strong fundamental catalysts across all of them.
Energy Dominates Volume, but Prices Lag Behind
BUMI led trading activity with approximately 618.16 million shares. The stock opened at Rp151.
BUMI gained only one rupiah from its previous closing price. The volume surge had not produced a significant price increase.
This condition showed an intense contest between buyers and sellers. Neither side had gained complete control.
Heavy volume can indicate accumulation. However, the same figure can also appear when existing holders distribute shares.
Investors need to examine broker activity and closing prices. Transaction volume alone cannot prove accumulation.
DEWA also recorded approximately 212.08 million shares. The activity showed strong market interest in mining-service companies.
Commodity prices helped maintain market attention. Middle East tensions also raised concerns about disruptions to global oil supplies.
However, expensive oil could increase global inflation. That risk could delay interest-rate cuts.
Third-Tier Stocks Accelerate More Aggressively
The sharpest movements came from smaller-capitalisation stocks. PURI, KBLV, KOKA, APEX and CTTH posted substantial gains.
PURI climbed from Rp134 to Rp156. It gained 16.42 percent during the early observation period.
KBLV moved from around Rp137 to Rp156. The stock gained approximately 13.87 percent.
KBLV’s volume reached 312.03 million shares. The combination of surging prices and transactions placed it at the centre of speculative trading.
KOKA rose from Rp218 to Rp238. It recorded a 9.17 percent gain.
KOKA also recorded approximately 267.51 million shares. The activity showed strong demand for a low-priced infrastructure stock.
APEX moved from around Rp137 to Rp145. Meanwhile, CTTH increased from Rp125 to Rp132.
Rapid gains can generate significant profits. However, prices can also reverse when buy orders begin to weaken.
Map of the Most Volatile Stocks
| Ticker | Starting Price | Intraday Price | Change | Volume | Market Reading |
|---|---|---|---|---|---|
| PURI | Rp134 | Rp156 | +16.42% ▲ | Not yet verified | Momentum looked very strong, but profit-taking risk increased. |
| KBLV | Around Rp137 | Rp156 | +13.87% ▲ | 312.03 million | Price and volume increased together, but investors still needed to examine possible distribution. |
| KOKA | Rp218 | Rp238 | +9.17% ▲ | 267.51 million | Strong demand appeared, but the fundamental catalyst still required confirmation. |
| APEX | Around Rp137 | Rp145 | +5.84% ▲ | Not yet verified | Energy sentiment provided support, but sustained volume remained unclear. |
| CTTH | Rp125 | Rp132 | +5.60% ▲ | Not yet verified | Rotation into low-priced stocks lifted the price, but liquidity required scrutiny. |
| BBRI | Rp2,970 | Rp3,000 | +1.01% ▲ | 192.96 million | Its more measured gain provided tangible support for the JCI. |
| BUMI | Rp150 | Rp151 | +0.67% ▲ | 618.16 million | The highest volume had not produced a comparable price gain. |
PURI recorded the largest gain on the list. However, complete volume data remained unavailable from open sources.
This limitation restricted any assessment of the rally’s quality. A price surge without verified volume demands greater caution.
KBLV showed a clearer relationship between price and trading activity. Volume reached 312.03 million shares as the price rose 13.87 percent.
However, heavy volume still carries two possibilities. Investors may have accumulated shares or absorbed distribution from existing holders.
KOKA displayed a similar pattern. Its price gained 9.17 percent on a volume of 267.51 million shares.
The market needs material information to support the movement. Without a catalyst, momentum may reverse quickly.
BBRI recorded a smaller change but stronger liquidity quality. Its movement also carried greater influence over the JCI.
BUMI presented a different picture. The market’s highest volume only pushed its price up 0.67 percent.
The comparison shows that heavy volume does not always produce strong gains. Order-book structure and selling pressure ultimately determine the outcome.
Ten Stocks Absorb Billions of Shares
| Rank | Ticker | Company | Share Volume | Estimated Lots | Trading Character |
|---|---|---|---|---|---|
| 1 | BUMI | Bumi Resources | 618,158,700 | 6,181,587 | Highly active, but the price gain remained limited |
| 2 | BNBR | Bakrie & Brothers | 440,172,300 | 4,401,723 | Liquid, but speculative in character |
| 3 | RBMS | Ristia Bintang Mahkotasejati | 376,265,200 | 3,762,652 | Property stock with high volatility |
| 4 | NTBK | Nusatama Berkah | 334,626,500 | 3,346,265 | Heavy activity with rapid reversal risk |
| 5 | EPAC | Megalestari Epack Sentosaraya | 320,885,400 | 3,208,854 | Heavy volume with speculative characteristics |
| 6 | KBLV | First Media | 312,025,000 | 3,120,250 | Price and volume surged together |
| 7 | KOKA | Koka Indonesia | 267,505,300 | 2,675,053 | Strong momentum, but the catalyst required confirmation |
| 8 | TPIA | Chandra Asri Pacific | 219,465,200 | 2,194,652 | Large capitalisation and sensitive to index movements |
| 9 | DEWA | Darma Henwa | 212,079,500 | 2,120,795 | Following market attention on mining stocks |
| 10 | BBRI | Bank Rakyat Indonesia | 192,957,100 | 1,929,571 | Strong liquidity and support for the JCI |
| Total for ten stocks | 3,294,140,200 | 32,941,402 | Liquidity remained concentrated among a small number of issuers | ||
The ten stocks recorded approximately 3.29 billion traded shares. This figure showed a considerable concentration of activity.
BUMI and BNBR accounted for more than one billion shares combined. However, heavy volume does not automatically indicate long-term buying.
Low-priced stocks require more shares to reach a specific transaction value. Therefore, investors must compare volume with its rupiah value.
BBRI recorded a lower volume than BUMI. However, BBRI carried a much higher price per share.
This difference allowed BBRI’s transaction value to remain substantial. Share volume alone cannot measure the strength of capital flows.
TPIA also carried a large capitalisation. Its movement could influence the index despite lower volume than third-tier stocks.
Petrochemicals and Telecommunications Also Provide Support
TPIA recorded approximately 219.47 million traded shares. The strong activity provided additional support for the market.
However, investors need to examine petrochemical margins and raw-material prices. Higher oil prices can increase naphtha costs.
Rupiah depreciation may also increase costs for companies that use the US dollar. That risk could weaken market sentiment.
In telecommunications, TLKM also supported the index. A defensive stock such as TLKM offered different characteristics from KBLV.
TLKM relied on a more stable business and cash flow. In contrast, KBLV displayed more aggressive price movements.
This difference matters to investors. Two issuers in closely related groups can carry significantly different levels of risk.
The Rally Faces a Rupiah Test
The JCI strengthened while the rupiah remained under pressure. Currency depreciation could quickly change foreign investors’ attitudes.
Global investors calculate their returns in foreign currencies. A stock-market gain may lose its value when the rupiah depreciates too sharply.
The market also faced corrections across several global exchanges. US technology stocks came under pressure after a strong rally.
Geopolitical tensions added uncertainty. Rising oil prices may benefit energy companies but create additional costs for other sectors.
These conditions mean the JCI rally remains exposed to risk. The market needs support from corporate earnings and consistent capital flows.
JCI Support and Resistance Map
| JCI Area | Function | Scenario | Signals to Watch |
|---|---|---|---|
| 6,245–6,268 | Immediate resistance | A breakout could open the path toward 6,286. | Buying volume and support from large banks. |
| 6,200 | Psychological level | Holding above this area would preserve market optimism. | Index closing position and foreign capital flows. |
| 6,175 | Initial support | The level marks the first boundary of a reasonable correction. | Selling pressure on banks and index-heavy stocks. |
| 6,122 | Secondary support | A decline toward this level would signal profit-taking. | Market breadth and rupiah movements. |
| 6,088 | Risk boundary | A fall below this level would increase correction risk. | Foreign outflows and pressure from global markets. |
The 6,200 area served as the most important psychological line. The JCI needed to remain above that level to preserve market confidence.
The 6,245–6,268 range formed the closest resistance area. The index needed support from large banks to break through that range.
If the JCI failed to hold above 6,175, the market could test 6,122. Deeper pressure could take the index toward 6,088.
Investors also needed to compare index gains with overall market breadth. The rally would become healthier if more stocks continued to advance.
Foreign capital flows provided another key indicator. Without foreign support, the rally could depend heavily on short-term transactions.
Heavy Volume Does Not Guarantee a Healthy Rally
The first session on July 20, 2026, showed strong optimism. However, demand for speculative stocks added risk behind the index rally.
Large banks provided a more stable foundation. Energy and commodity stocks benefited from global price movements.
Meanwhile, third-tier stocks moved much faster than their underlying fundamentals. This pattern required a high degree of caution.
The rally’s quality would only become clear through closing prices, transaction values and foreign investor positions. An intraday surge alone cannot establish a long-term direction.
Disclaimer: This report provides market information and analysis. It does not recommend buying, selling or holding any particular stock.